Struggling with complex load charts? Worried a small mistake could cause a big accident? You need a clear, step-by-step guide to read them correctly and safely.
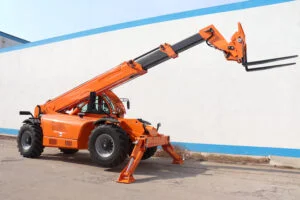
A telehandler load charts is your most important safety tool. It’s a diagram showing the maximum weight you can lift based on the boom’s extension and angle. Using it correctly prevents tipping and ensures the stability of your machine and the safety of everyone on site.

I’ve been in the telehandler business for over 15 years, shipping machines from our factory in Shandong, China, all over the world. The one thing that connects every single user, from a contractor in Europe to a farmer in Australia, is the need to understand this chart. It’s not just a sticker in the cab; it’s the rulebook that keeps you safe. Let’s break it down together, so you can operate with total confidence.
What Is a Telehandler Load Charts?
Confused by all the lines and numbers on a load chart? Think it’s just a suggestion? Let’s clear up what this critical safety document really means for you.
A telehandler load chart is a visual map of your machine’s safe lifting capacity. It tells you exactly how much weight you can safely lift at various boom heights and forward reaches, preventing dangerous situations like tipping over.
Let’s get one thing straight. That big number you see, like 3,000 kg or 4,000 kg, is not the weight you can lift in any position. I’ve seen many operators make this mistake. That number represents the machine’s maximum capacity under ideal conditions. This usually means the boom is fully retracted and at a high angle, close to the machine.
The moment you start extending that boom, the game changes completely. It’s all about physics, specifically the principle of a lever. The further you extend the boom, the longer the “lever arm” becomes. This dramatically increases the tipping force, so the weight you can safely lift drops fast. The load chart isn’t just a guide; it’s a map of your machine’s physical limits. Ignoring it is like ignoring a cliff edge.
The Myth of “Rated Capacity”
Many people believe the “rated capacity” is a constant. This is a dangerous misunderstanding. The actual safe working load changes with every movement of the boom.
| Boom Position | Why Capacity Changes | Practical Example |
|---|---|---|
| Fully Retracted, High Angle | The load’s center of gravity is close to the machine’s tipping point. | This is where you can lift the maximum advertised weight, like 4,000 kg. |
| Partially Extended, Mid Angle | The lever arm is longer, increasing the tipping force. | Your capacity might drop to 2,000 kg. |
| Fully Extended, Low Angle | The lever arm is at its longest, creating maximum tipping force. | Your capacity could be as low as 500 kg. |
Thinking “I lifted this much at this height yesterday” is a trap. It ignores tiny but critical changes in boom extension that can make today’s lift unsafe.
How Should Operators Read Telehandler Load Charts?
Feel like you need to be a mathematician to read a load chart? Worried you’ll misinterpret the data under pressure? There is a simple, repeatable process to get it right.
To read a load chart, first find the boom extension distance on the horizontal axis. Then, find the boom angle or height on the vertical axis. The point where they intersect shows the maximum safe lifting capacity for that specific position.
I remember talking to an experienced operator who almost had a serious accident. He told me, “I just use my gut. When the back wheels feel light, I know I’m near the limit.” This is one of the most dangerous myths in our industry. By the time you feel the machine getting light, you are already past the safety margin and in the tipping zone.
The load chart is designed to keep you far away from that feeling. It’s not about gut instinct; it’s about data. The chart is your co-pilot, providing the numbers you need to make safe decisions, not just “feel” them. Relying on visual cues is a gamble because the point of instability can arrive suddenly, especially when turning or on uneven ground.
A Step-by-Step Reading Process
Let’s break it down into simple steps that anyone can follow. Never guess. Always check the chart.
- Identify the Load: Know the exact weight of the material you are lifting, including the pallet, chains, or any attachments.
- Determine the Placement: Measure the height (vertical) and reach (horizontal) where you need to place the load. This is your target coordinate.
- Consult the Correct Chart: Telehandlers often have different charts for different attachments (forks vs. bucket). Make sure you are using the right one.
- Locate Your Position:
- Find the required reach distance on the bottom (horizontal) axis of the chart.
- Find the required height on the side (vertical) axis.
- Follow those lines until they intersect on the chart.
- Verify Capacity: Check the number on or just outside the curved line from your intersection point. If your load’s weight is less than or equal to this number, the lift is safe. If it’s more, you must reposition the machine closer to the target to reduce the reach.
What Assumptions Do Telehandler Load Charts Make?
Ever wonder if the load chart applies to every situation? Worried that real-world conditions might make the chart inaccurate? The chart operates on some very important assumptions.
Load charts assume perfect conditions: the telehandler is on a firm, level surface, with properly inflated tires, no wind, and the load is static and centered. Any deviation from these conditions will reduce your actual safe capacity.
The numbers on your load chart are calculated in a perfect world. But job sites are rarely perfect. I often remind customers that the chart is a baseline, a starting point. It doesn’t know if you’re working on soft dirt, in high winds, or lifting a load that could swing.
These are what we call dynamic risks. A sudden stop or a quick turn can momentarily increase the force of the load, an effect not shown on the static chart. A gust of wind can push against a large load, adding side force. The chart is your best friend, but it trusts you to use your judgment and account for the real world. You have to be the one to assess the conditions and reduce the stated capacity to maintain a safe margin.
The “Perfect World” Checklist
Before you trust the chart’s numbers completely, ask yourself if your worksite meets these assumptions.
- Is the ground firm? Soft soil, mud, or gravel can compress under the tires, changing the machine’s angle and stability.
- Is the ground level? The chart assumes a 0-degree slope. As we’ll see later, even a small incline drastically changes everything.
- Are the tires inflated correctly? Under-inflated tires can cause the machine to sway and become unstable.
- Is it calm? Wind can exert significant force on large loads like panels or roofing materials, acting like a sail.
- Is the load static? The chart doesn’t account for the forces created by swinging loads or sudden movements of the boom.
If the answer to any of these is “no,” you must be more cautious and reduce the maximum load you attempt to lift.
How Are Telehandler Load Charts Zones Used?
See those different shaded areas or sections on the chart? Wondered why the capacity line isn’t a smooth curve? These zones represent different limiting factors for your machine.
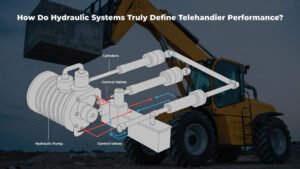
Load chart zones indicate the reason for the capacity limit at that point. One zone might be limited by the machine’s tipping stability, while another is limited by the hydraulic system’s strength or the boom’s structural integrity.

This is a detail that many training programs miss. They teach you how to find a number on the chart, but not why the chart looks the way it does. Understanding the zones gives you a much deeper sense of how your machine works. For example, when the boom is retracted and at a high angle, the limit is often the structural or hydraulic strength.
The machine is very stable, but the components can only handle so much force. But when you extend the boom far out, the limit is almost always stability. The hydraulics could lift more, but the machine would tip over. Knowing which zone you’re in helps you understand the risk. Are you risking breaking a component, or are you risking a catastrophic tip-over? This knowledge makes you a smarter, safer operator.
Understanding the Boundaries
The lines and zones on a load chart are not arbitrary. They represent critical boundaries between different types of potential failure.
| Zone Type | What it Means | Your Primary Concern |
|---|---|---|
| Structural/Hydraulic Zone | Usually found at high boom angles and short extensions. The limit is the physical strength of the boom or the power of the hydraulic cylinders. | Component failure. The machine won’t feel unstable, but you could damage the boom or hydraulics by exceeding the limit. |
| Stability Zone | Found at long boom extensions and lower angles. The limit is the point where the machine will tip forward. | Tipping over. The machine’s own weight is the limiting factor, not the strength of its parts. |
The point where the curve on the chart changes its shape is often the transition between these zones. Recognizing this helps you appreciate that the risks change depending on where you are operating on the chart.
Does Gradeability Affect Safe Telehandler Lifting?
Think you can lift the same amount on a small hill as on flat ground? Confused about how slopes impact your machine’s safety? The grade changes everything about your lift.
Yes, gradeability has a massive impact. Operating on any slope, even a slight one, dramatically reduces your telehandler’s safe lifting capacity. The load chart is only accurate for perfectly level ground (0% grade).
Over the years, our customers have asked countless questions about custom features, but the conversation always comes back to safety and stability. One of the most critical factors is the ground itself. A telehandler’s stability depends entirely on its center of gravity staying within its wheelbase. When you are on a slope, your center of gravity shifts downhill.
This simple fact shrinks your margin of safety before you even start to lift. Lifting a load shifts the center of gravity even further. Combining a slope and a lifted load is one of the quickest ways to get into a dangerous situation. Always remember: the load chart assumes a flat, level surface. If you are not on one, the numbers on that chart are no longer reliable.
The Center of Gravity Shift
The core issue is how a slope affects your machine’s balance point.
- On Level Ground: The center of gravity is low and centered between the wheels, providing a wide, stable base.
- On an Incline: The center of gravity shifts downhill. If you are facing uphill, it shifts toward the rear axle, increasing stability. If you are facing downhill, it shifts toward the front axle, drastically decreasing stability and making a forward tip-over much more likely.
- Lifting on a Side Slope: This is the most dangerous scenario. The center of gravity shifts toward the downhill wheels, shrinking your stability triangle and making a sideways tip-over a very real and sudden risk.
Because of this, most manufacturers recommend that all lifting operations be performed on level ground whenever possible.
How Do Slopes Affect Telehandler Stability?
You know slopes are bad, but how bad are they really? Need to understand exactly how an incline undermines your machine’s stability? Let’s look at the physics.
Slopes dangerously shift the machine’s center of gravity downhill. This reduces the force needed to tip the machine over, making the load chart’s capacity values invalid and creating a high risk of a forward or sideways tip-over.

Think of your telehandler’s stability as a simple balancing act. On level ground, the machine’s weight is perfectly balanced over the wheelbase. When you park on a slope, gravity starts pulling the machine downhill. This effectively moves the center of gravity closer to the downhill wheels.
Imagine trying to balance a tray. It’s easy when it’s level, but if you tilt it, you have to work much harder to keep things from sliding off. Your telehandler is the same. On a slope, it’s already “tilted,” so it has less “room to balance” before it tips. Even a 5-degree slope can reduce your true safe lifting capacity by 50% or more, especially at full reach. The load chart in your cab cannot account for this; you have to.
Quantifying the Risk
It’s not just a feeling; it’s measurable. While every machine is different, here is a general idea of how a slope can impact your capacity.
| Slope Condition | Impact on Stability | Operator Action Required |
|---|---|---|
| 0° (Level Ground) | Maximum stability. The load chart is accurate. | Follow the load chart precisely. |
| 1-3° (Slight Slope) | Stability is noticeably reduced. The machine’s center of gravity has shifted. | Drastically reduce the load weight from the chart’s value. Avoid extending the boom to its maximum reach. |
| 5°+ (Moderate Slope) | Stability is critically compromised. The risk of tipping is extremely high. | Do not perform lifting operations. Reposition the machine to a level area first. It is not safe to lift on this grade. |
Remember, the safest approach is always to find or create a level pad for your telehandler before attempting any significant lift. Never trust the load chart on uneven ground.
Conclusion
Understanding your telehandler’s load chart is not optional; it’s the core of safe operation. It’s about respecting the machine’s limits and accounting for real-world conditions on every single lift.
Follow us on :YouTube.